Budget vs actual that goes all the way to the invoice.
QuickBooks Online's Budget vs. Actuals report stops at the account. DrillFi maps your budget to your chart of accounts once, then makes every number a door: open a section, then a budget category, a GL account, a vendor, and the exact transaction behind the variance.
The example: Sunfield Pantry Co., August 2026
Want this on your own QuickBooks file?
Connect QuickBooks Online, bring your budget and map it once, and every line on your P&L drills like this one.
Fifteen checks that run on every sync, so you find the problem before your board does.
Duplicate invoices, vendors coded to different accounts, a recurring bill that did not arrive, an unusual jump in one expense. Nobody has to remember to look: DrillFi checks the books each time they sync and shows what it found, with the dollars attached.
What it found on the sample file
Wondering what's hiding in your own books?
For $100, one time, we'll run all 15 checks on your QuickBooks Online file, rank what we find by dollars, and walk you through it. No subscription.
Flux analysis: explain only the variances that moved.
Budget vs. actual tells you where you missed a plan. Flux analysis asks a different question: did each group behave the way the earlier months said it would? DrillFi works out what every group should have been, lists the ones that are off by more than you care about, and takes you from there to the vendor and the invoice.
The example: Sunfield Pantry Co., August 2026
What each group was expected to be in Aug, from the 6 months before it (Feb to Jul), against what it was. A group is listed for review when its difference is at least 10% of its expected amount and at least $1,000.
What you control
See which groups moved on your own books.
Connect QuickBooks, map your budget once, and the first month of flux is ready to review. Each budget line starts as a group, and you choose how each one is expected to behave.
The metrics your board asks for, built from your own accounts.
Most tools hand you a fixed set of ratios. DrillFi lets you combine any two lines from your books into a KPI, shows the inputs behind every number, and carries the result onto your dashboard and into the monthly package.
Build your own KPI
Pick any two lines from the sample books and combine them. This works like the KPI builder in the product's Config page, where a saved KPI shows up on the dashboard and can be included in the monthly package.
Track the numbers your board asks for.
Build your own KPI formulas on your live QuickBooks data, with every input shown.
Who owes you, who you owe, and what is actually selling.
The P&L tells you what happened. The subledgers tell you who is behind it: aging for receivables and payables, and sales by item and by customer, this month and year to date against last year. All four come from the same synced QuickBooks data as the P&L.
The example: Sunfield Pantry Co., August 2026
See who owes you and what is selling, on your own books.
A/R and A/P aging, sales by item and sales by customer, compared with last year and tied to your P&L.
A board-ready package with your name on it, built every month.
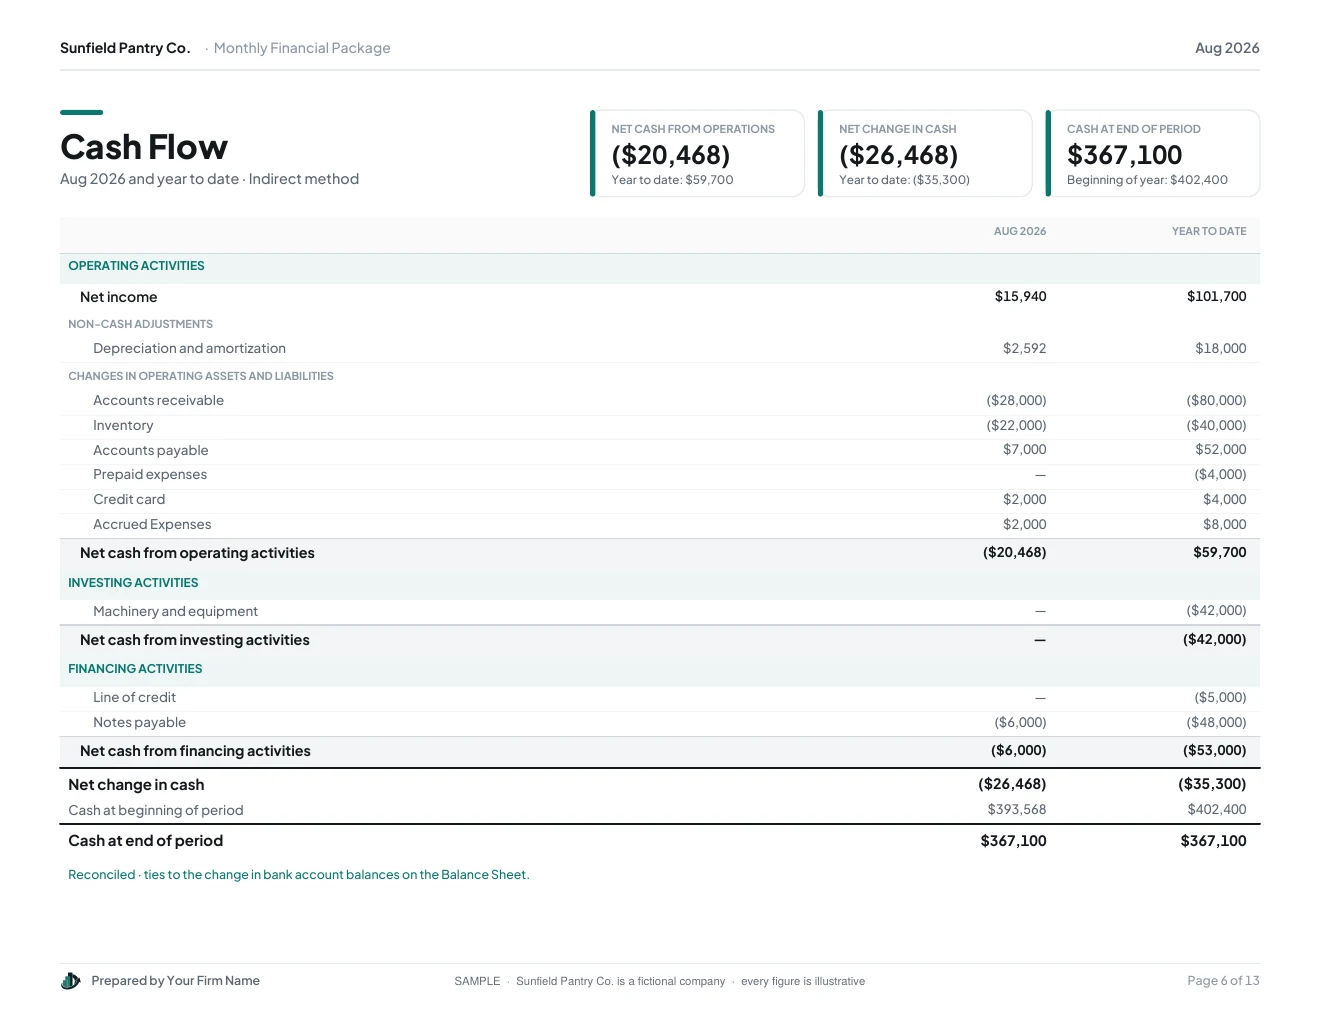
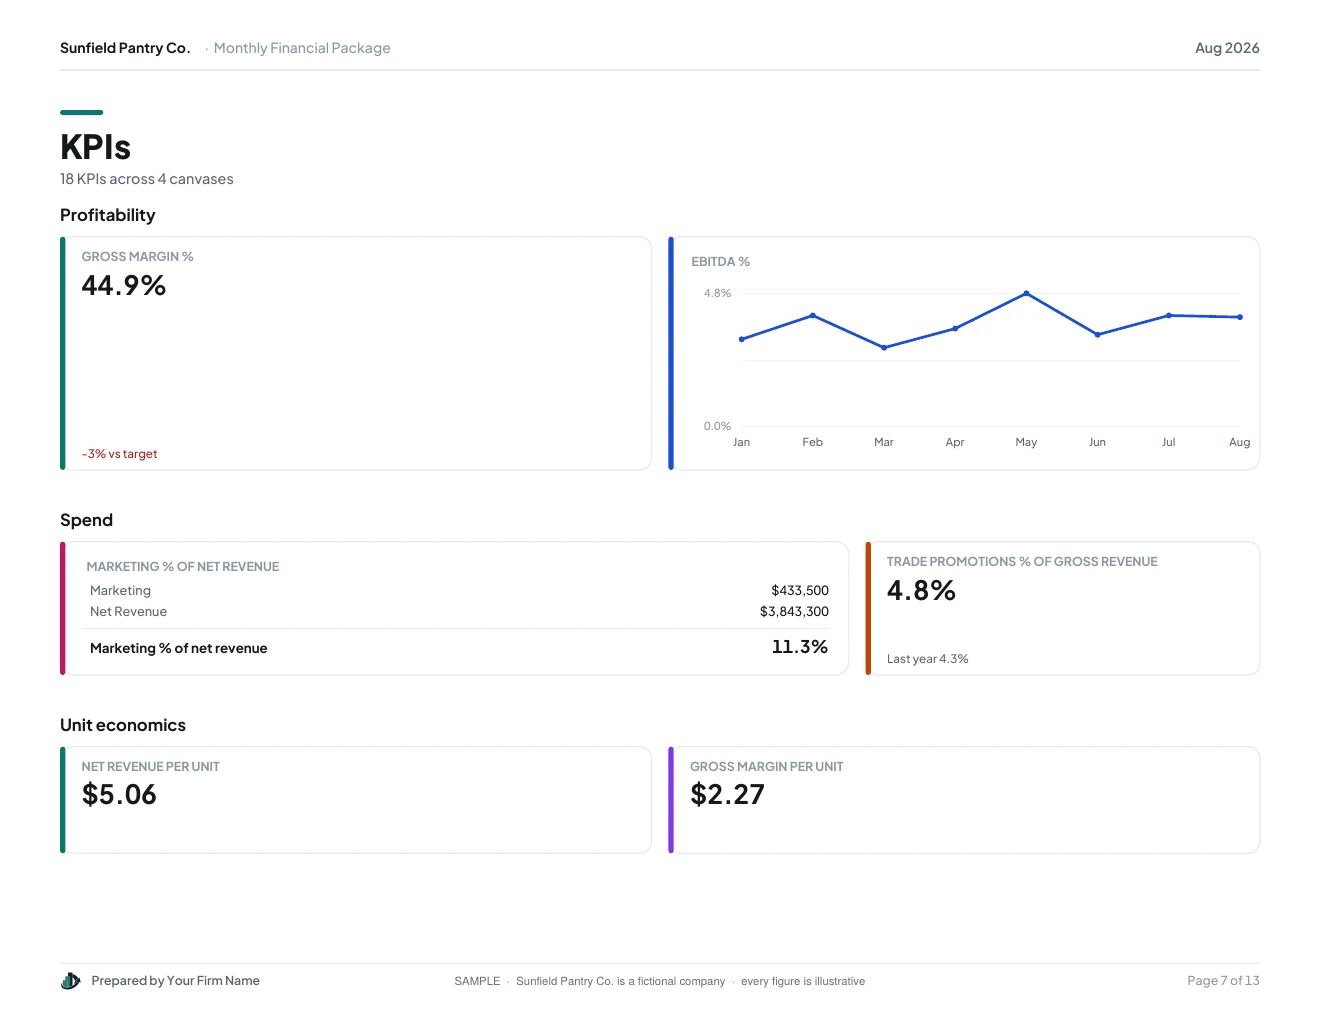
The P&L, balance sheet, cash flow, KPIs, subledgers and the items still needing attention, laid out as one branded PDF from the same mapped QuickBooks data. You set the sections and branding once, and each period it is ready to send.
See a real one: 13 pages for Sunfield Pantry Co.
This is the actual PDF your clients would receive for August 2026: the P&L against budget and last year, balance sheet, cash flow, KPIs, A/R and A/P aging, sales by item and customer, and the open issues.
Open the 13-page sample packagePDF, opens in a new tab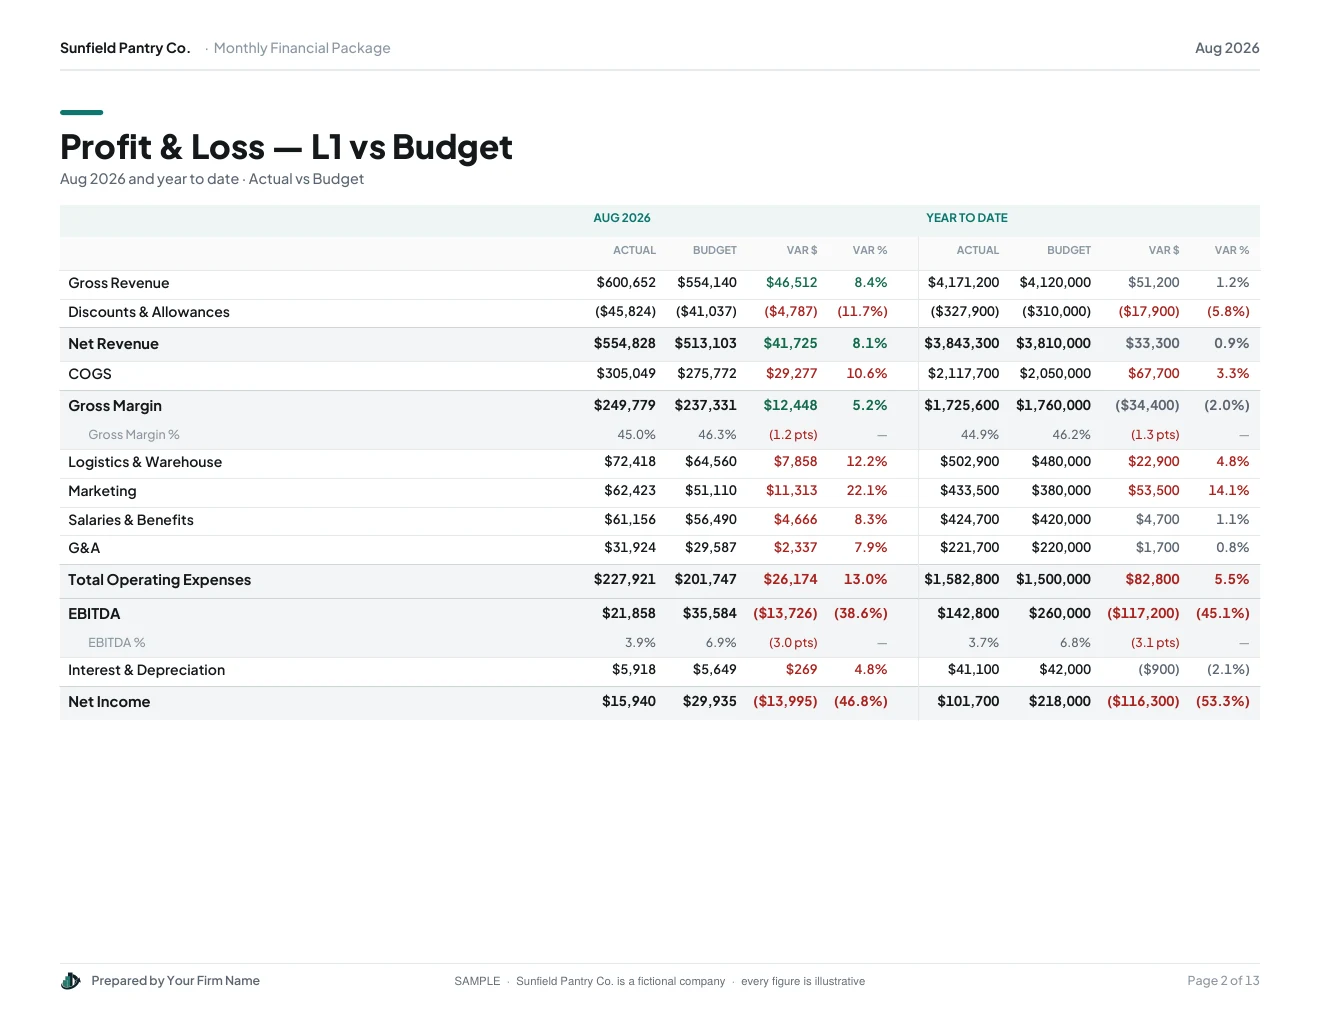
Make it yours
White-label it
The monthly package is a PDF generated each period with your firm's name and color. Try it:
- Profit & LossL1 / L2, vs budget, LY
- Balance Sheetthis month, last month, last year
- Cash Flowindirect method
- KPIscharts and tables
- SubledgersAR/AP aging, sales by item and customer
- Items needing attentionalways last
A simplified preview of the layout. The sample PDF above is the real output.
Stop rebuilding the package every month.
Set your sections and branding once. DrillFi builds the PDF package from your mapped QuickBooks data each period.
What's in this demo
Everything below runs on one fictional sample company. Each part uses the same synced data, so the P&L, alerts, KPIs, subledgers and monthly package always agree.