QuickBooks Online budget to actual reporting software that drills down to the transaction.
DrillFi maps your budget to your QuickBooks chart of accounts, then lets you click any variance down to the vendor and the invoice behind it. It also supports variance analysis and flux review for the month-end close, and flags 15 kinds of bookkeeping problems before your board sees them.
No signup for the demo. Drill the P&L, see the alerts, build a KPI, browse the subledgers and white-label a monthly package, all on a fictional sample company.
Every line drills to the invoice. The same data drives the alerts, KPIs, subledgers and monthly package in the full demo.
Open the full demoNew: flux analysis. Each group against what the earlier months predicted. Outbound freight is $28,580 over expected in the sample, and one click shows the duplicate invoice behind it.
Try the flux exampleYour budget and your books rarely speak the same language.
QuickBooks Online's Budget vs. Actuals report expects your budget to line up with your chart of accounts one-to-one. Most budgets don't. Board categories like trade spend, logistics and marketing sit on top of many GL accounts, so teams rebuild the comparison in Excel every close.
Map it once
Start from your QuickBooks accounts or the budget you already keep in Excel. A guided setup matches every account to one budget line and ties the result to your net income before it goes live. Many accounts can roll into one line, and every future close reconciles automatically.
See the P&L it producesClick the variance open
Marketing is over budget. Click it, and keep clicking: budget category, GL account, vendor, invoice. No GL export, no separate QuickBooks login.
Drill into the sample P&LCatch mistakes before the close
Duplicate invoices, a vendor booking to the wrong account, a recurring bill that never arrived. DrillFi flags them on every sync and links each one to the exact row.
See the alerts on the sample fileBudget vs actual reporting, plus everything a controller checks around it.
Everything below runs on top of your existing QuickBooks Online company file. Nothing to migrate, nothing to re-enter, and DrillFi only reads from QuickBooks.
Budget to actual reporting with custom GL mapping
Map your budget's own categories to the QuickBooks accounts that actually book the spend, once. Compare against budget, forecast or last year, at any level, and add the full-year budget and what's left of it beside year to date.
How mapping worksFive-level drill-down, without opening QuickBooks
Go from a board line item to budget category, GL account, vendor and the exact transaction, all inside DrillFi.
Try it in the demoFlux analysis: explain only what moved
Each month is compared with what the earlier months predicted, group by group. You set how much of a miss is worth a look, and DrillFi lists only the groups past it, with the vendors and GL accounts behind the change and a note saved against the month. Download the workpaper as Excel with live formulas.
See a flux exampleHow flux analysis works15 automated checks on every sync
Duplicate invoices, vendor coding drift, near-duplicate vendor names, missing recurring bills, unmapped accounts, expense spikes, personal-expense leakage and more, so problems surface before your close, not during it. Turn on sign-off to mark each one reviewed or dismissed, with a note, so your team can see what is still open.
See the alertsSign-off: a close checklist your team can see
Mark each alert or flux item reviewed, or dismiss it as not an issue, and leave a note. DrillFi records who did it and when, and reopens the item with your note attached if a later sync changes the amount. The monthly package shows what is still open.
Try sign-off in the demoHow sign-off worksKPIs, including working capital
Build your own KPI formulas from any P&L line, GL account or unit-sales figure, with a live preview and the budget and last-year value next to each result. Or use the 12 working-capital KPIs (DSO, DPO, cash conversion cycle, inventory turnover) built in, with every input shown.
Try the KPI builderBalance sheet, cash flow and subledgers
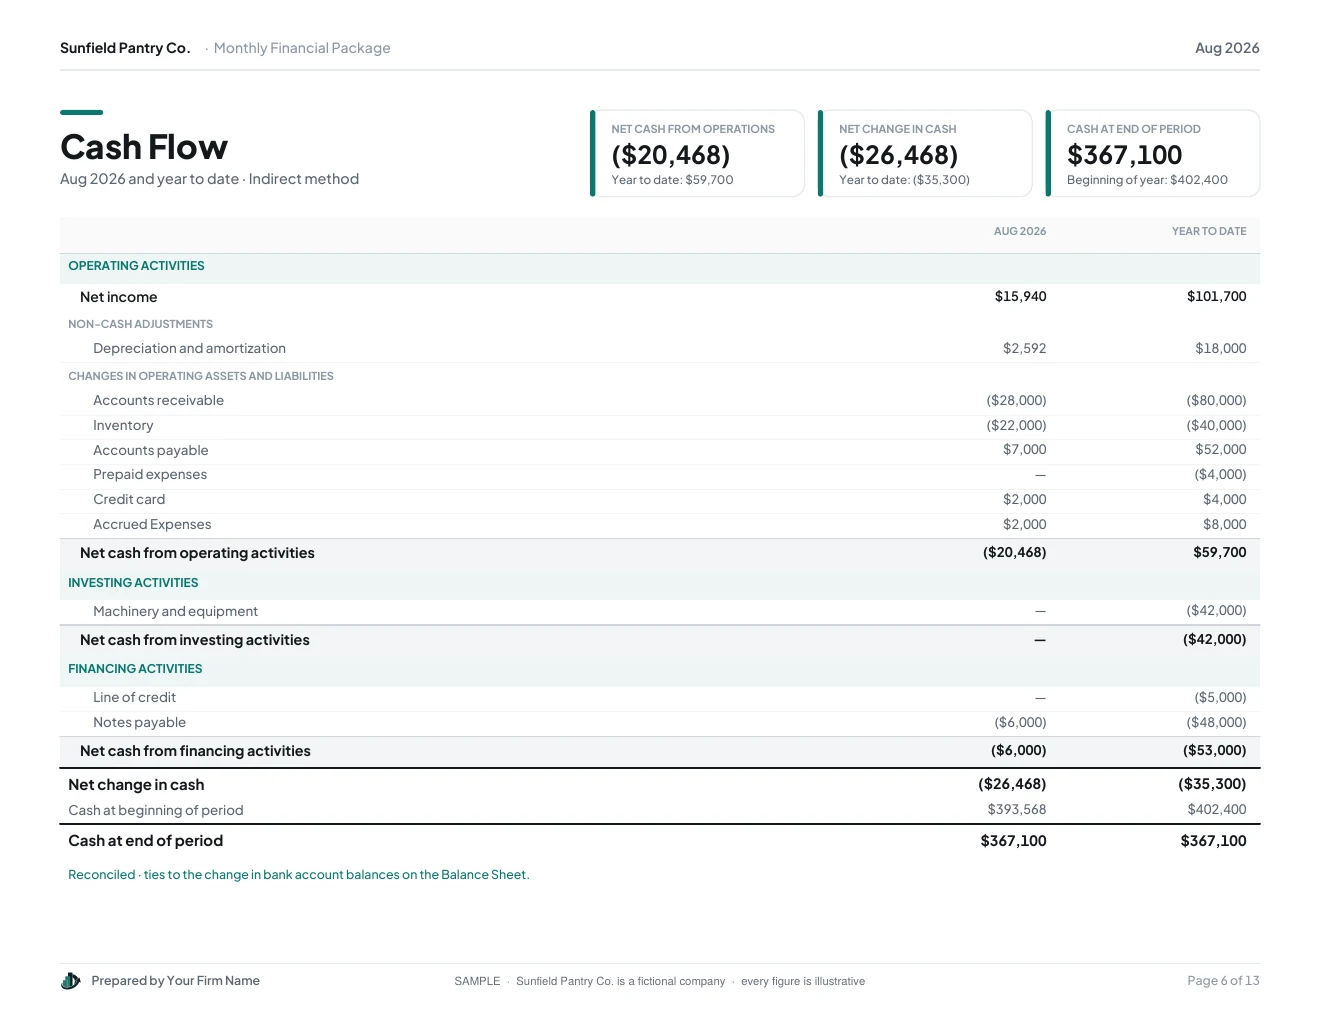
A cash flow statement built from your balance sheet history, AR and AP aging, and item-level sales, all from the same synced data as the P&L.
See the subledgers in the demoWhat's includedA white-label monthly package
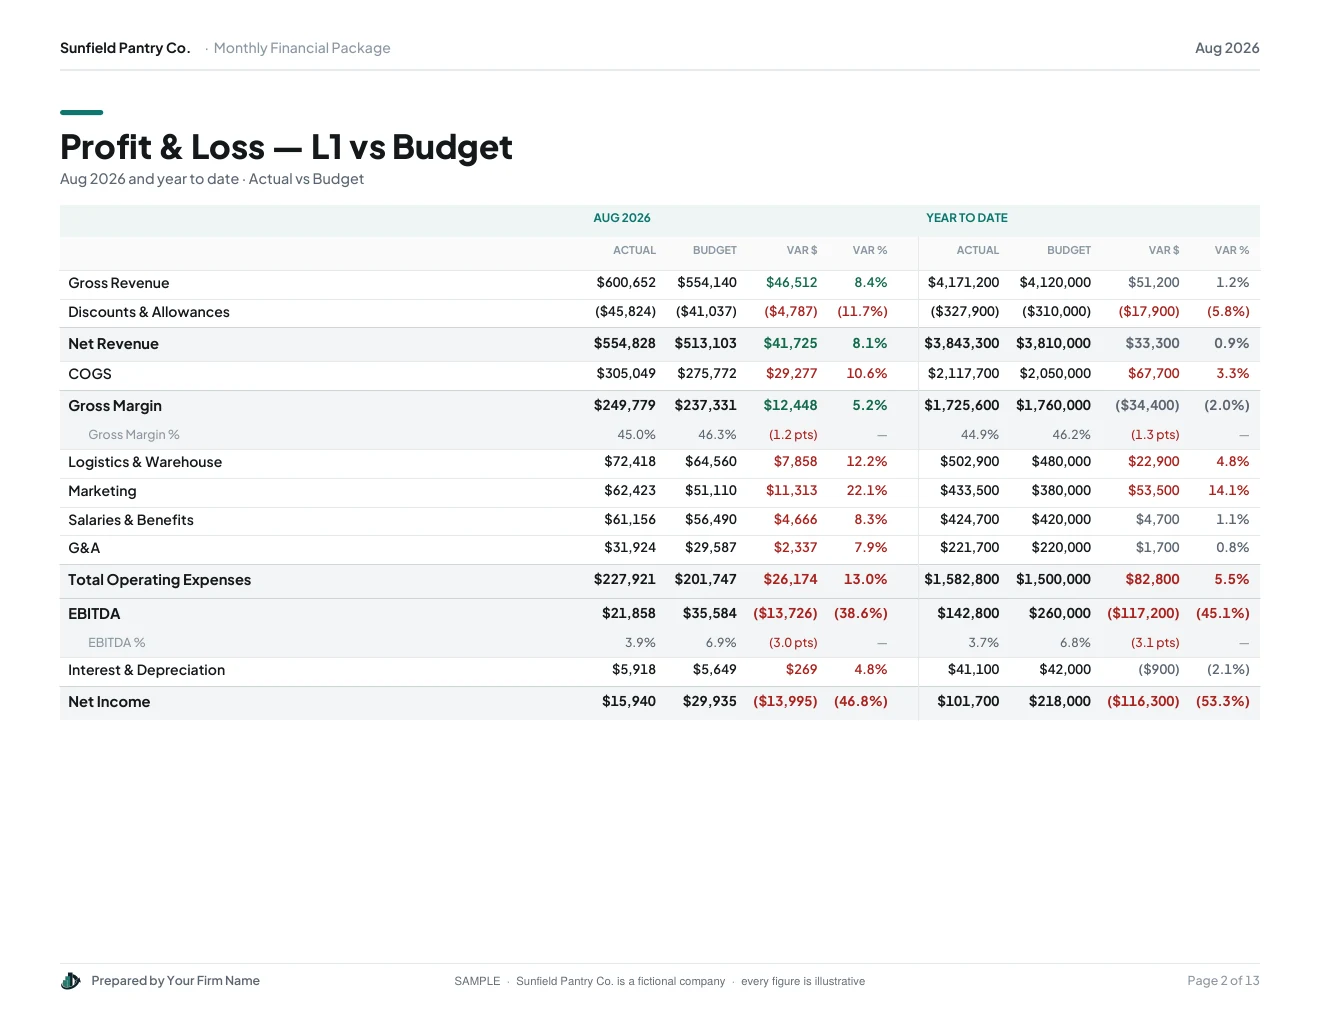
Generate a branded PDF each month with your firm's name, logo and color: P&L, balance sheet, cash flow, KPIs, subledgers, and the items that still need attention. Excel exports are live workbooks: variances, subtotals and the summary tabs are formulas, so they recalculate when you change a number.
Preview the packageOpen a sample PDF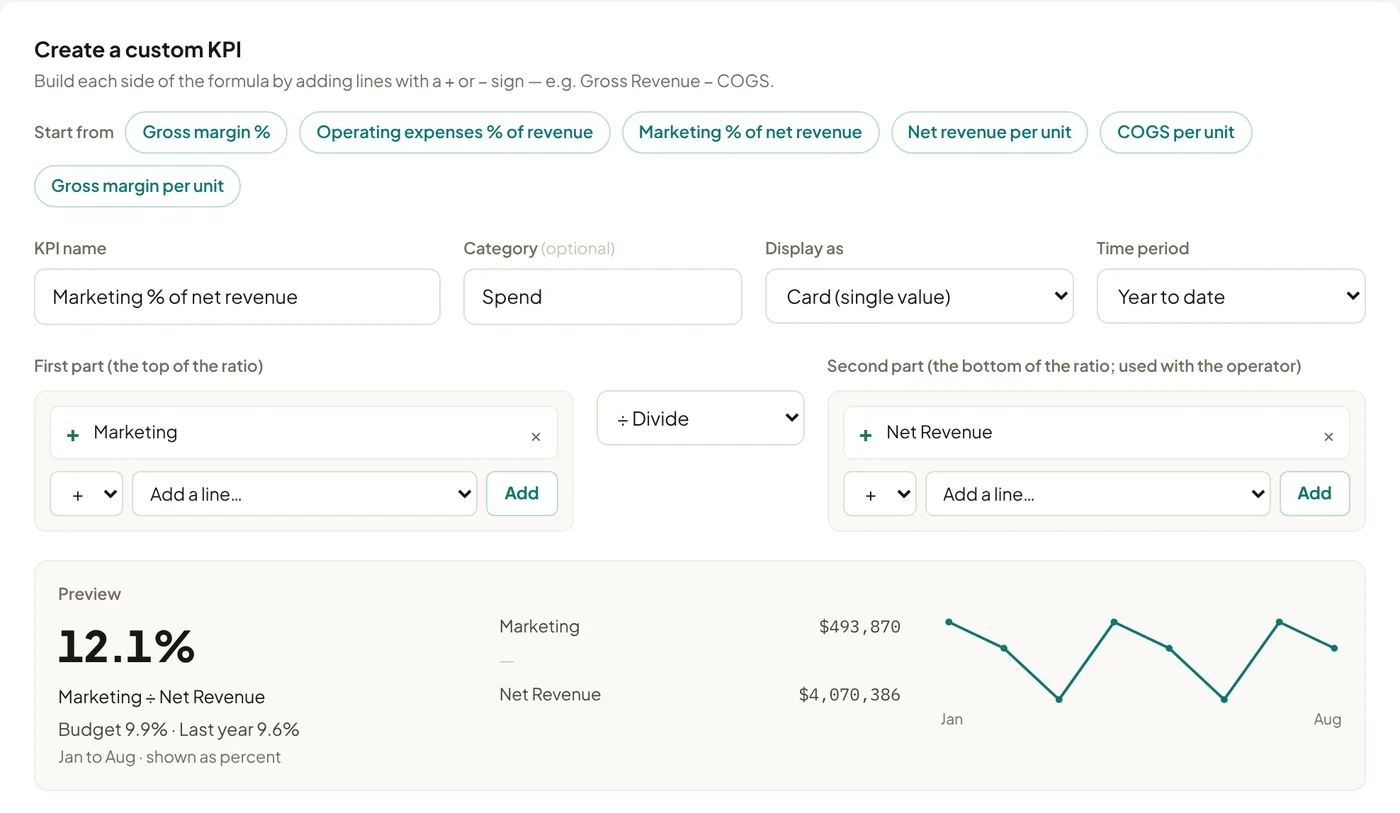
Built for two people who both live inside this problem.
For fractional CFOs and advisory firms
Run every client's budget-to-actual reporting from one hub.
You manage 5 to 40 QuickBooks files and close each one on a spreadsheet template that breaks a little more every quarter.
- One multi-client hub across every company file you manage
- Custom KPI formulas and alert thresholds set once per client, reused every close
- A white-label monthly package with your firm's name, logo and color that you can re-bill as your own service
- Setup wizard is designed to be run by you: map a client's accounts once, without engineering help
For founders and operators
Get your books checked, not just reviewed.
You don't need another dashboard. You need to know what's actually wrong before it shows up in a board meeting.
- A one-time $100 Financial Check Up: we run all 15 checks on your QuickBooks file and walk you through what we find
- Duplicate invoices, vendor coding drift and unmapped accounts explained in plain English
- Keep DrillFi running on your books, or bring in fractional finance help if you need more
Three steps to get from QuickBooks to a mapped P&L.
Setup is built to be run by you, start to finish, with no backend work on our end required to get live.
Connect QuickBooks Online
One OAuth connection, the same as connecting any other QuickBooks app. Nothing to export from QuickBooks first.
Map your chart of accounts to your budget structure
Upload the budget you already keep in Excel, or build one from your QuickBooks accounts. A guided setup maps your categories to GL accounts once, and you review it before it goes live.
Flags, KPIs, and the full drill-down go live
Every sync re-runs all 15 checks and refreshes the P&L, five levels deep, down to the transaction.
DrillFi Financial Check Up: a second set of eyes on your QuickBooks.
For $100, one time, we run all 15 checks on your QuickBooks Online file, review what they find, and walk you through what's wrong and what to fix first. Founder with no controller? It's also a way to see what kind of finance help you actually need.
Guides for QuickBooks Online reporting.
Plain answers to the questions that come up around budget vs actual, the month-end close and cleanup, with or without DrillFi. All guides
- Ask My Accountant and Uncategorized ExpenseFind what is sitting in these accounts, reclassify it and stop it coming back.
- Budget vs Actuals showing the full-year budgetFour causes and the fixes, in the order to try them.
- Month, YTD and last year in one viewWhat QuickBooks can and cannot show side by side, and what works.
- Find duplicate bills and invoicesThe built-in warning catches one kind. How to find the rest.
- QuickBooks budgeting limitationsWhere budgeting runs out and what to use instead.
- Variance and flux analysisExplain what moved, and only what moved, at month-end close.
- Choosing a reporting toolFive questions that point to the right approach, including when it is not DrillFi.
- 12 working capital KPIsDSO, DPO, cash conversion cycle and more, with the formulas shown.
- See the transactions behind a varianceFour ways to get from a budget variance to the invoice.
- Budget vs Actuals not matching the P&LSix checks, in the order to run them.
- Budget by classSet it up, run the report, and find what has no class.
- Budget variance analysisFormulas, thresholds and commentary examples.
Budget vs actual in QuickBooks Online, answered.
What is budget to actual reporting for QuickBooks Online?
Budget to actual reporting compares what you planned to earn and spend with what your books show, line by line. QuickBooks Online has a built-in Budget vs. Actuals report. DrillFi adds a mapping between your budget categories and your chart of accounts, drill-down from any variance to the transaction, and automated checks on the underlying data.
How is DrillFi different from QuickBooks' Budget vs. Actuals report?
QuickBooks compares budget lines to accounts one-to-one. DrillFi lets many GL accounts roll up into one budget category, and then lets you click any number down through the GL account and vendor to the invoice. It also runs 15 automated checks on every sync.
What is flux analysis, and does DrillFi do it?
Flux analysis compares each month with what the earlier months predicted, so you explain only the groups that moved more than they should. DrillFi does it on your own budget lines: you choose how each group is expected to behave, set the percent and dollar threshold, and review the vendors, GL accounts and transactions behind each flagged group. Explanations are saved against the month, and the workpaper downloads as Excel with live formulas.
Does DrillFi do variance analysis in QuickBooks Online?
Yes. DrillFi compares actual vs budget by line and by group, shows the variance in dollars and percent, and lets you click it down through the general ledger account and vendor to the invoice that caused it. For month-over-month movement it adds flux analysis, so you explain only what moved more than expected.
Can DrillFi help with the month-end close?
Yes. Before a close is final, DrillFi runs 15 automated checks on your QuickBooks Online data, such as duplicate bills, uncategorized expenses and missing classes, lets you sign off each flagged variance with a note, and builds the monthly management report or board package from the same numbers.
Does DrillFi change anything in my QuickBooks file?
No. DrillFi only reads from QuickBooks Online to build your reports. It does not create or edit transactions, accounts or vendors in your file.
Do I need to migrate data or rebuild my chart of accounts?
No. DrillFi connects to your existing QuickBooks Online company file with one OAuth connection. You bring the budget you already have (upload your spreadsheet, or build it from your QuickBooks accounts in the guided setup) and map accounts once. There is no spreadsheet to keep in sync afterward.
Does DrillFi work with QuickBooks Desktop or other accounting platforms?
DrillFi works with QuickBooks Online. Other accounting platforms are not supported today.
Can I try DrillFi before signing up?
Yes. The live demo runs on a fictional sample company with no signup, and every P&L line drills to the transaction. You can then create a free account and connect your own QuickBooks Online file. Advisory practices can apply for partner access.
How is DrillFi priced?
DrillFi is priced by the number of QuickBooks files connected, not by seat. One company file is $40 a month, and advisory plans start at $99 a month for up to three files. See the pricing table on this page.
Priced by files connected, not by seat.
Running one company? It's $40 a month. Managing several? The base fee covers the platform and a set number of files, and each additional connected QuickBooks file beyond that is billed per file, at a lower rate on every step up. Re-bill your own clients however fits your practice.
All prices are in US dollars (USD). Free to try during early access: create an account and connect your own company. The advisory plans above are finalized directly with each practice when you apply.
Get started.
Create a free account for your own company and connect QuickBooks Online. Accounting firms and advisory practices that serve multiple clients can apply for partner access below.
Free while DrillFi is in early access. No credit card.
Accounting firm or advisory practice?
Thanks — got it.
We'll follow up at the email you gave us. In the meantime feel free to reach out directly at hello@drillfi.com.